How to do location Mapping in ppt presentation – Complete Guide
Location mapping is widely used in fields like
Management Consulting, Sales, Marketing, etc where people demonstrate the
positioning of the subject property and the connectivity status from the subject
property.
Today we will see how to prepare a complete
Location map consisting of implementation of different icons, laying of roads,
changings the design style of the map, etc
Getting the map from Google Maps
There are two ways of inserting the
map
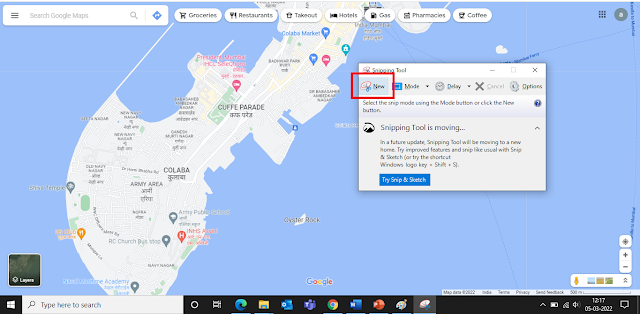
1. Method 01 - We can take the screenshot from google
maps, by hitting the PrtScr button and pasting it in paint. Later, saving the
image in the desired location
2.
Method 2 With the help of a snipping
tool, cut the area of the map you require and save the image in the desired
location.
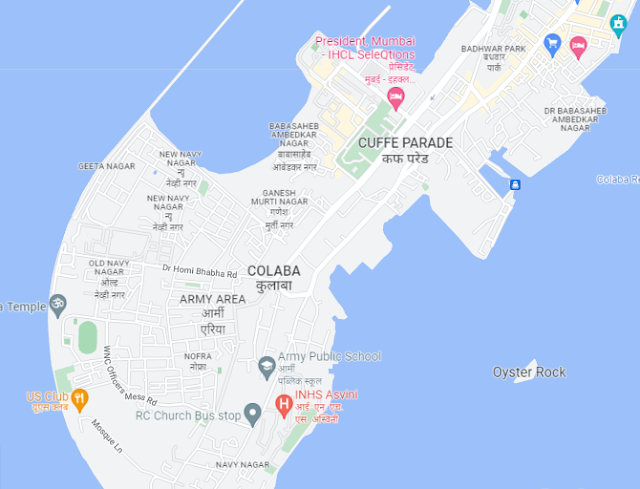
Below you can see the desired
area of the map is cropped with the help of the snipping tool and saved.
 |
Inserting Image in ppt of Map
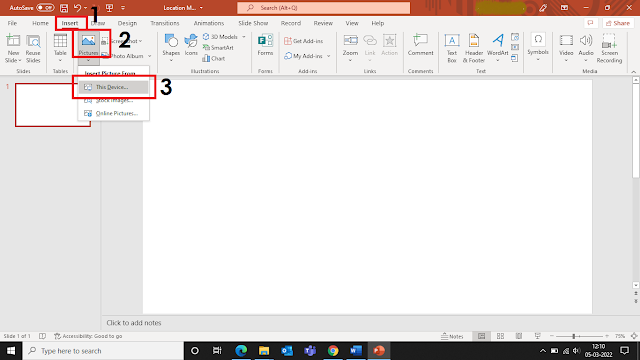
To insert the image,
Steps - Click
on Insert -> Click on Pictures -> Click this device
Now, we have inserted the image of the location we
have cropped since the map looks very normal firstly, we will learn to change the Colour of the Map.
Changing Image Colour in ppt
There are two ways to get the Picture Format tab, you
can double click on the image, and directly it will take you to the Picture
format tab, or you can single click on the image, then click on the Picture
Format tab.
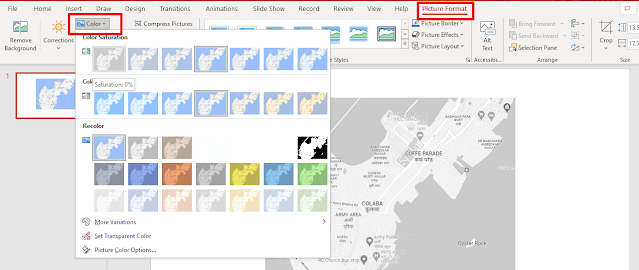
Once you have clicked on the picture format tab, you
can change the color of the map as seen below
You can choose the color style whichever suits your
presentation the best, for me, I have opted for the first style.
Inserting the Location Point
Once the Map and the desired style have been
inserted, the first thing we can do is to insert the location point so we can
further have a reference point of the map we are executing.
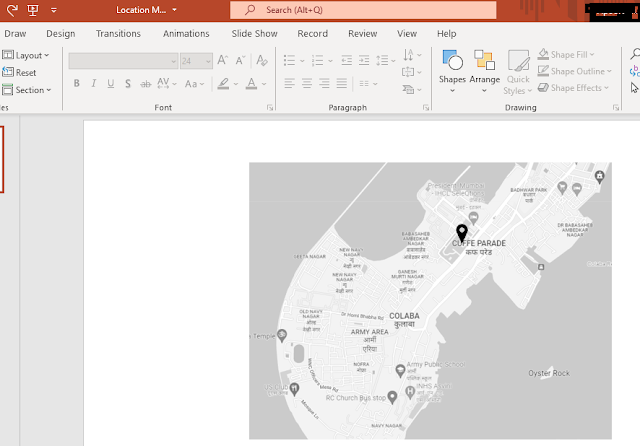
To insert the Location pinpoint, click on Insert -> Icons
After you have moved to the insert pan, you can
type Location and insert the icon as you can see in the below image
Adjust the location pinpoint and drag to the
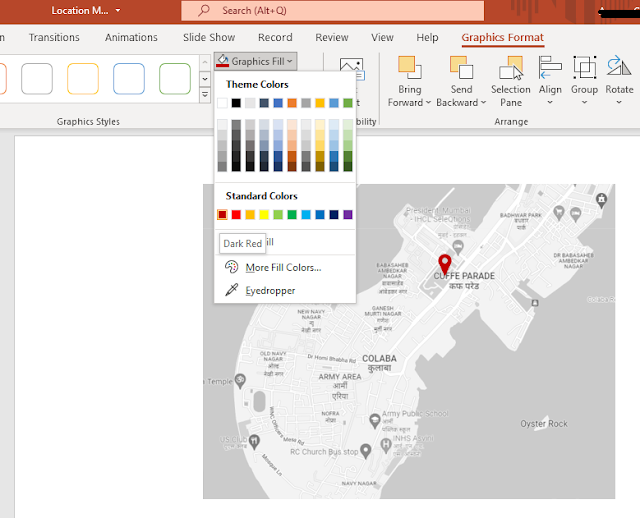
desired subject location. As the color of the pinpoint is not properly visible,
we can change to color as per our requirement, for that
Double
click over pinpoint -> Graphic fill -> Desired Colour
Inserting Roadways Connectivity
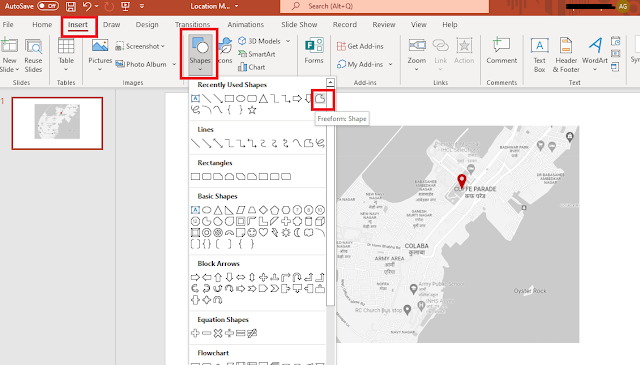
Click on Insert -> Shapes ->
Freeform shape
After Selecting the freeform shape, you can drag
the points on the map where the roads are and mark the roads as required.
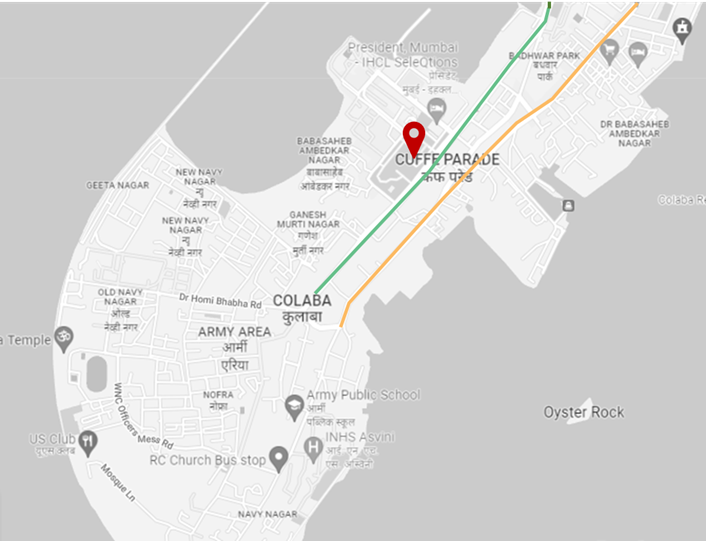
Once you have marked the lines, you can change the
color of the freeform and the weight of the freeform as required to your
requirement.
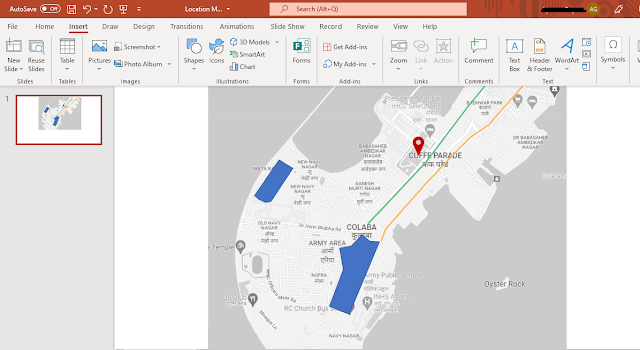
Differentiating demographic population in different area’s
We can highlight the demographic area distribution
based on the population with different colors with the same use of freeform
shape. Here I will demonstrate to give you a bit idea regarding it.
With the freeform, we have pointed the locations
and now, we will be filling them with different colors, to make them more
easily understandable.
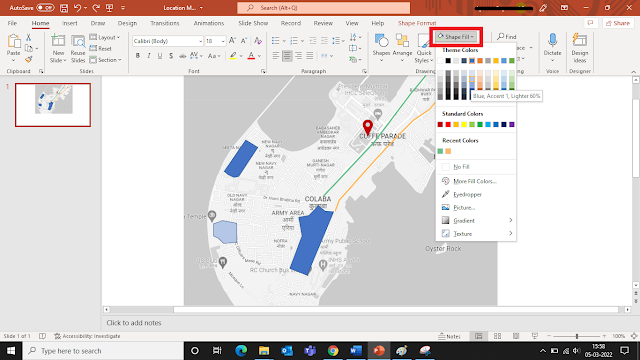
As we can see, the borders the still visible of
different colors, so we can change the same from
Shape outline -> No outline/selecting
the same color of the shape fill, you can follow steps
from the image provided below
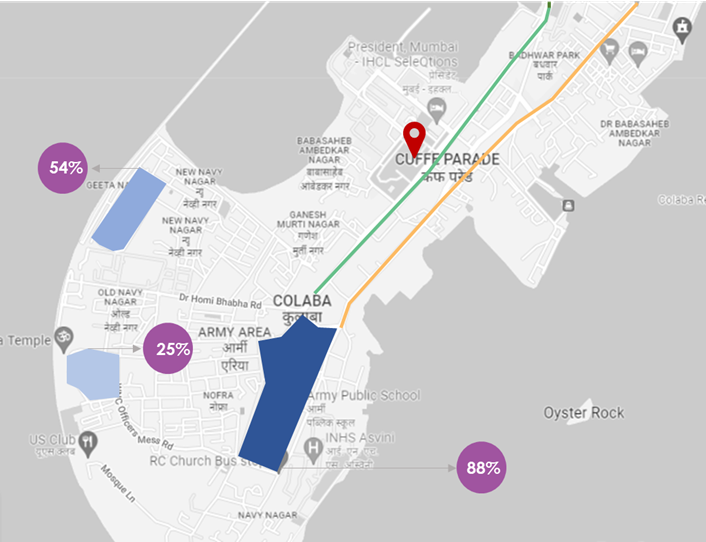
Now we are almost ready with the demographic representation,
You can further play more with the Insert ->Shapes pan and further
upgrade the model to the required need as you can see in the below case.
Grouping items in ppt
The last thing that mandatory has to be performed so
that every item you have placed in the image stays in the same position is to
group the image.
Step 1 For that firstly make a left click from the
mouse and select the full screen as you can see below
Step 2 Picture Format -> Right corner click on Group
Here we have the final output. Further,
you can add a text box, icons, borders, etc based on the requirement and the
need.








No comments:
Post a Comment